Profiles
The Profiles page provides a detailed view of the demographic and physical data collected from users who have created a personal profile within Smart Assistant. It helps you analyze your audience composition, such as age, gender, and body measurements, offering valuable insights for personalization, size recommendations, and product strategy.
By studying this data, you can understand who your active users are, how their profiles are distributed, and how this information influences conversion and engagement metrics across your eCommerce experience.
Period selection and filters
At the top of the page, you can select the Time Range you want to analyze. The available options are Last 24 hours, Last week, Last month, Last year, or a Custom range.
You can also use the Filter panel to refine your analysis by the following parameters:
- Profile : filters data by the type of user profile created (for example, size recommendation, virtual fitting, or general user profile).
- Age Group : allows filtering by predefined age segments.
- Gender : limits the analysis to male, female, or all users.
- Source Distribution : filters by device type, such as desktop, tablet, mobile, or app.
- Channel : filters by the platform through which users interacted with Smart Assistant.
- Language Distribution and Country Distribution : allow focusing on users from specific languages or countries.
These filters can be combined to create targeted views, such as “female users aged 25–35 using mobile devices in Spain.” After selecting your filters, click Apply to update all widgets or Reset to clear and reload the full dataset.

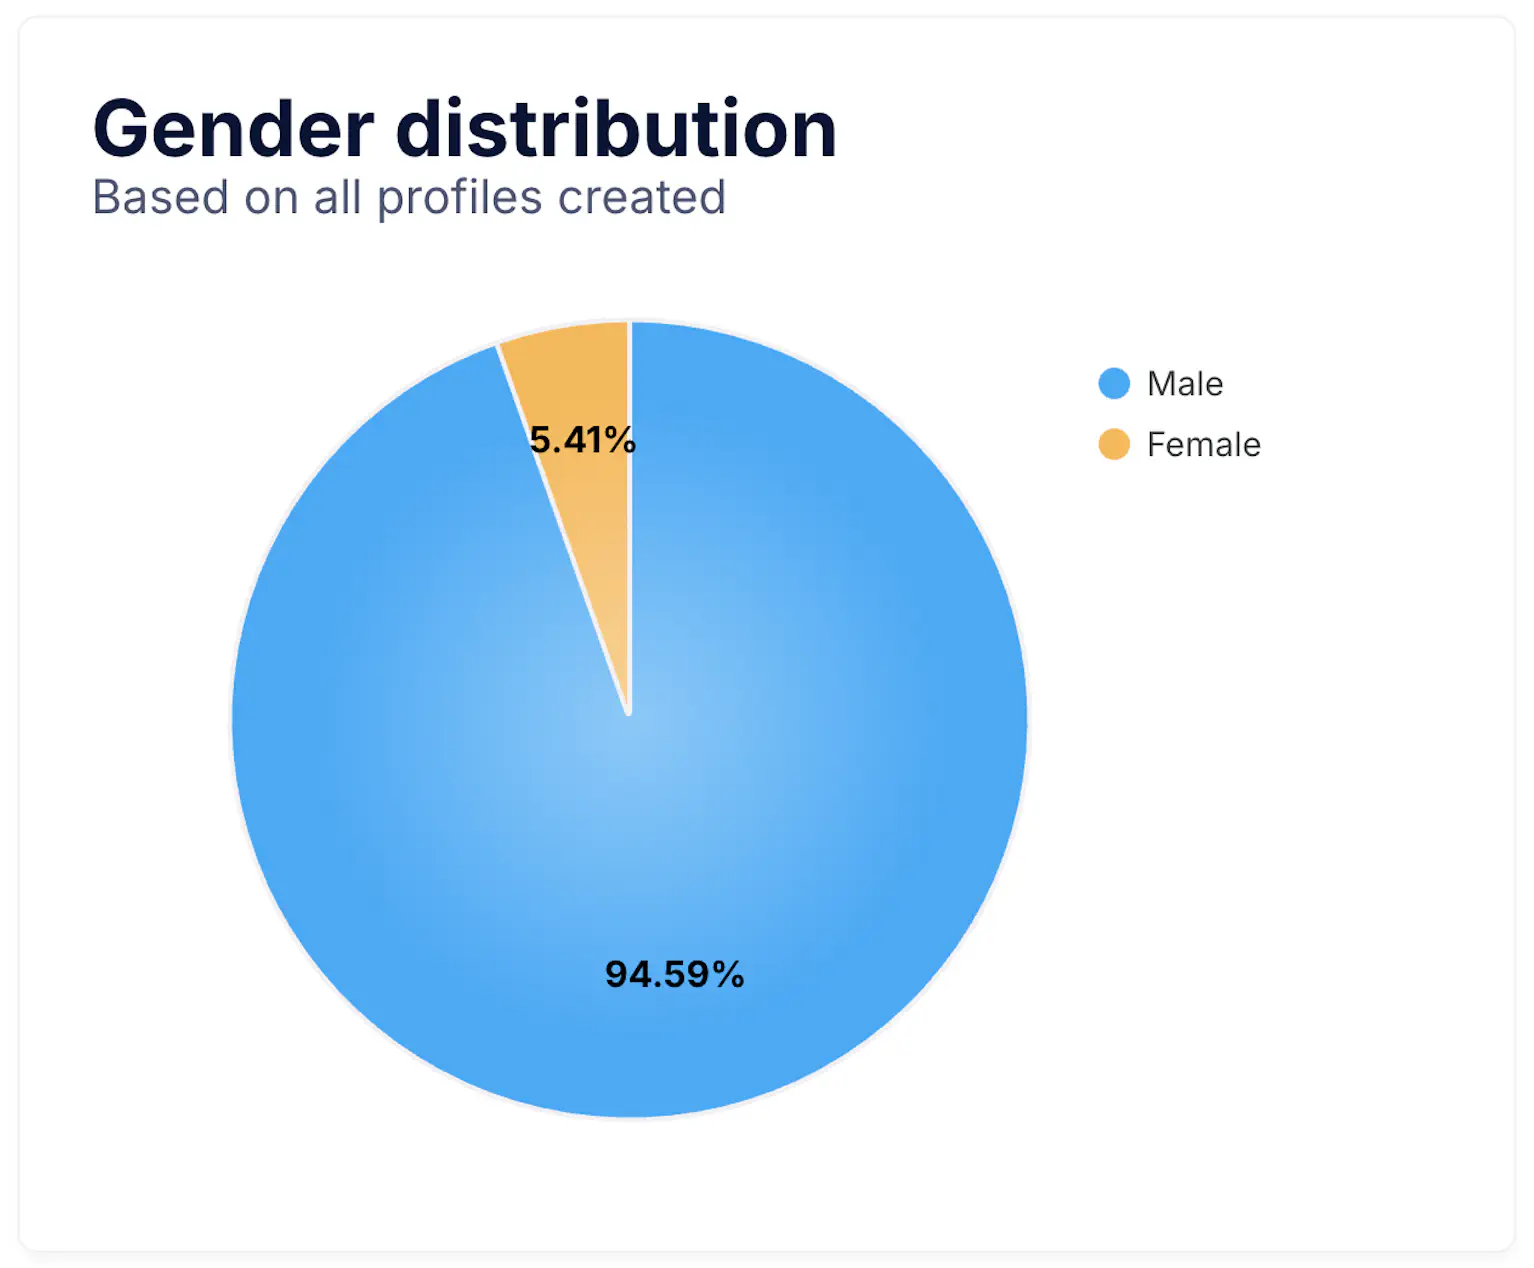
Gender distribution pie chart
This chart shows how Smart Assistant profiles are distributed by Gender . It provides an overview of the gender balance among users who have created a profile and can help identify the dominant audience segment.
A significant skew toward one gender might reflect the nature of your catalog or marketing strategy. Balanced ratios often indicate broader audience reach.
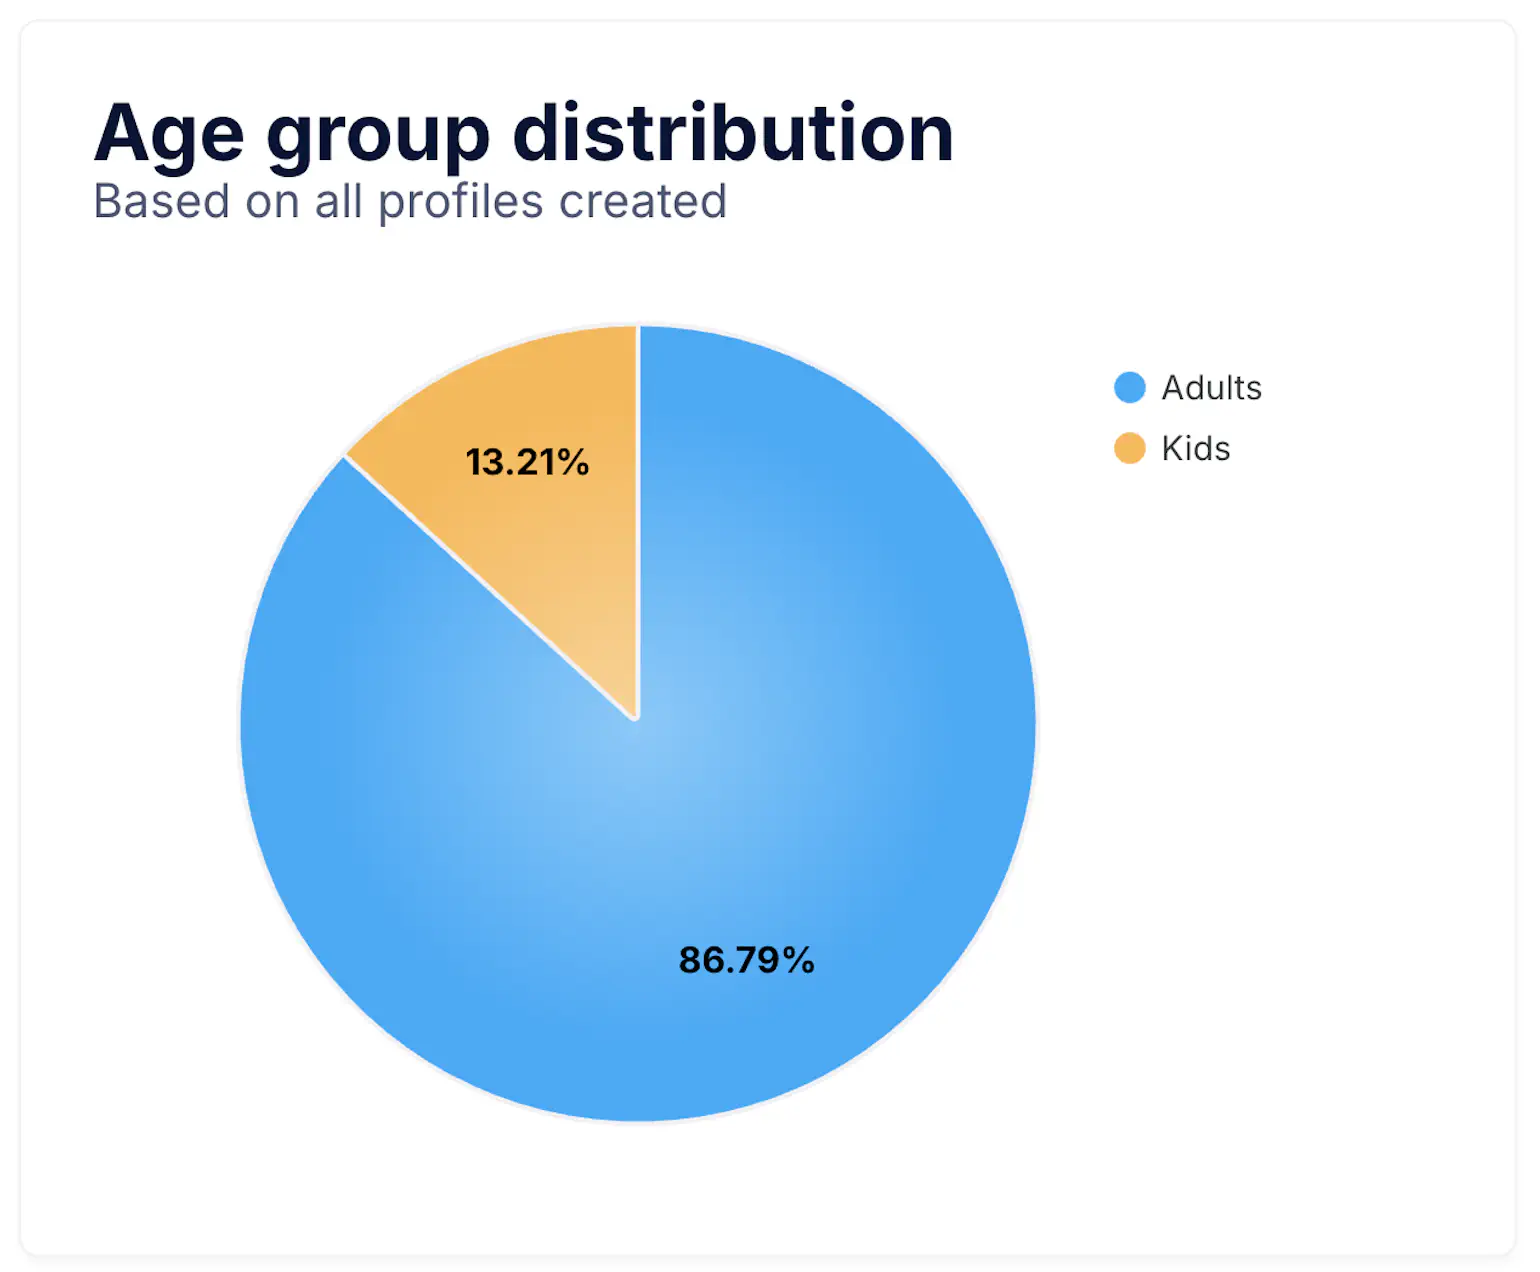
Age group distribution pie chart
This chart displays the distribution of Age Group among all profiles. It helps identify which age segments are most represented in your user base and whether your Smart Assistant is engaging the intended audience.
For instance, a higher percentage of adult users may indicate a mature customer base, while an increase in younger segments could point to emerging markets or evolving shopping trends.
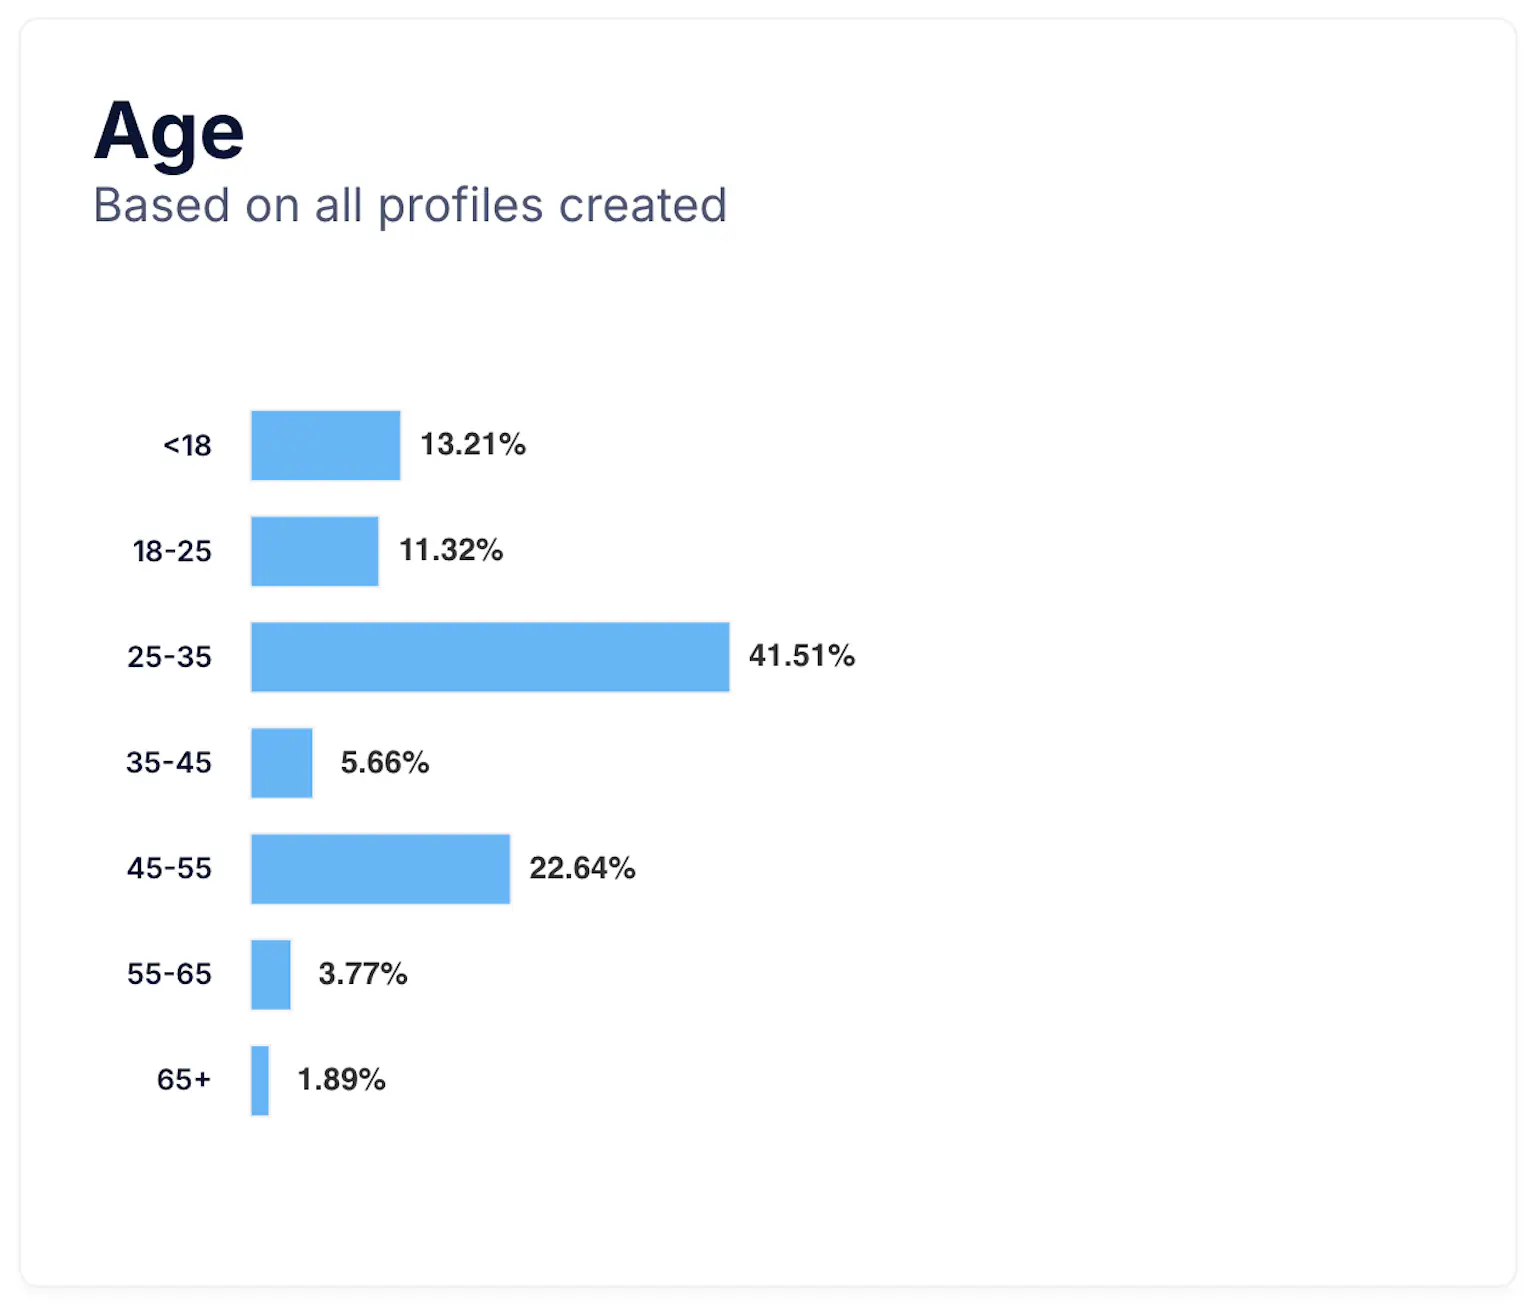
Age bar chart
Shows the detailed breakdown of user ages within specific ranges. This chart provides a more granular view of age diversity and helps you detect potential gaps or opportunities in targeting.
Marketing teams can use this information to tailor campaigns, messages, or product selections for the most active age ranges.
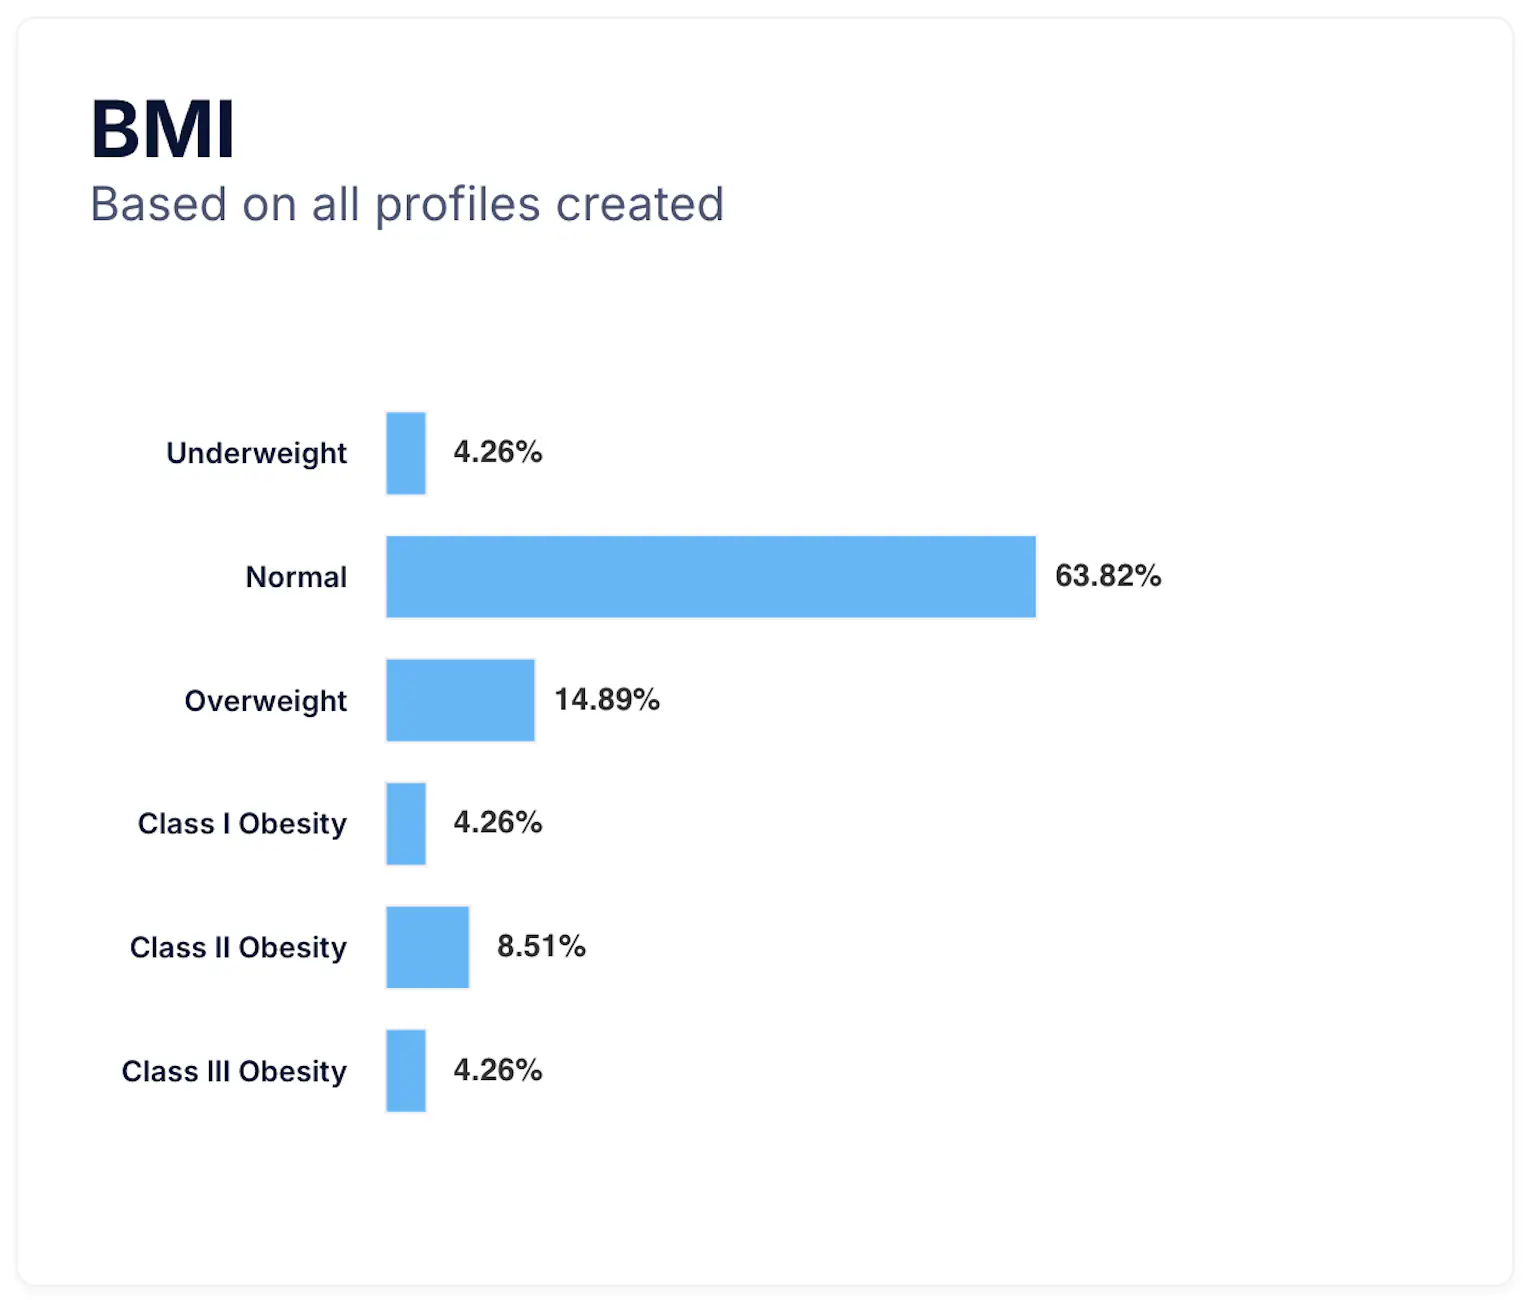
BMI bar chart
Displays the distribution of Body Mass Index (BMI) categories among profiles. It classifies users into ranges such as Underweight, Normal, Overweight, and different Obesity classes based on the data they entered when creating their profile.
Understanding this distribution helps you evaluate how well your catalog adapts to real customer profiles and size inclusivity.
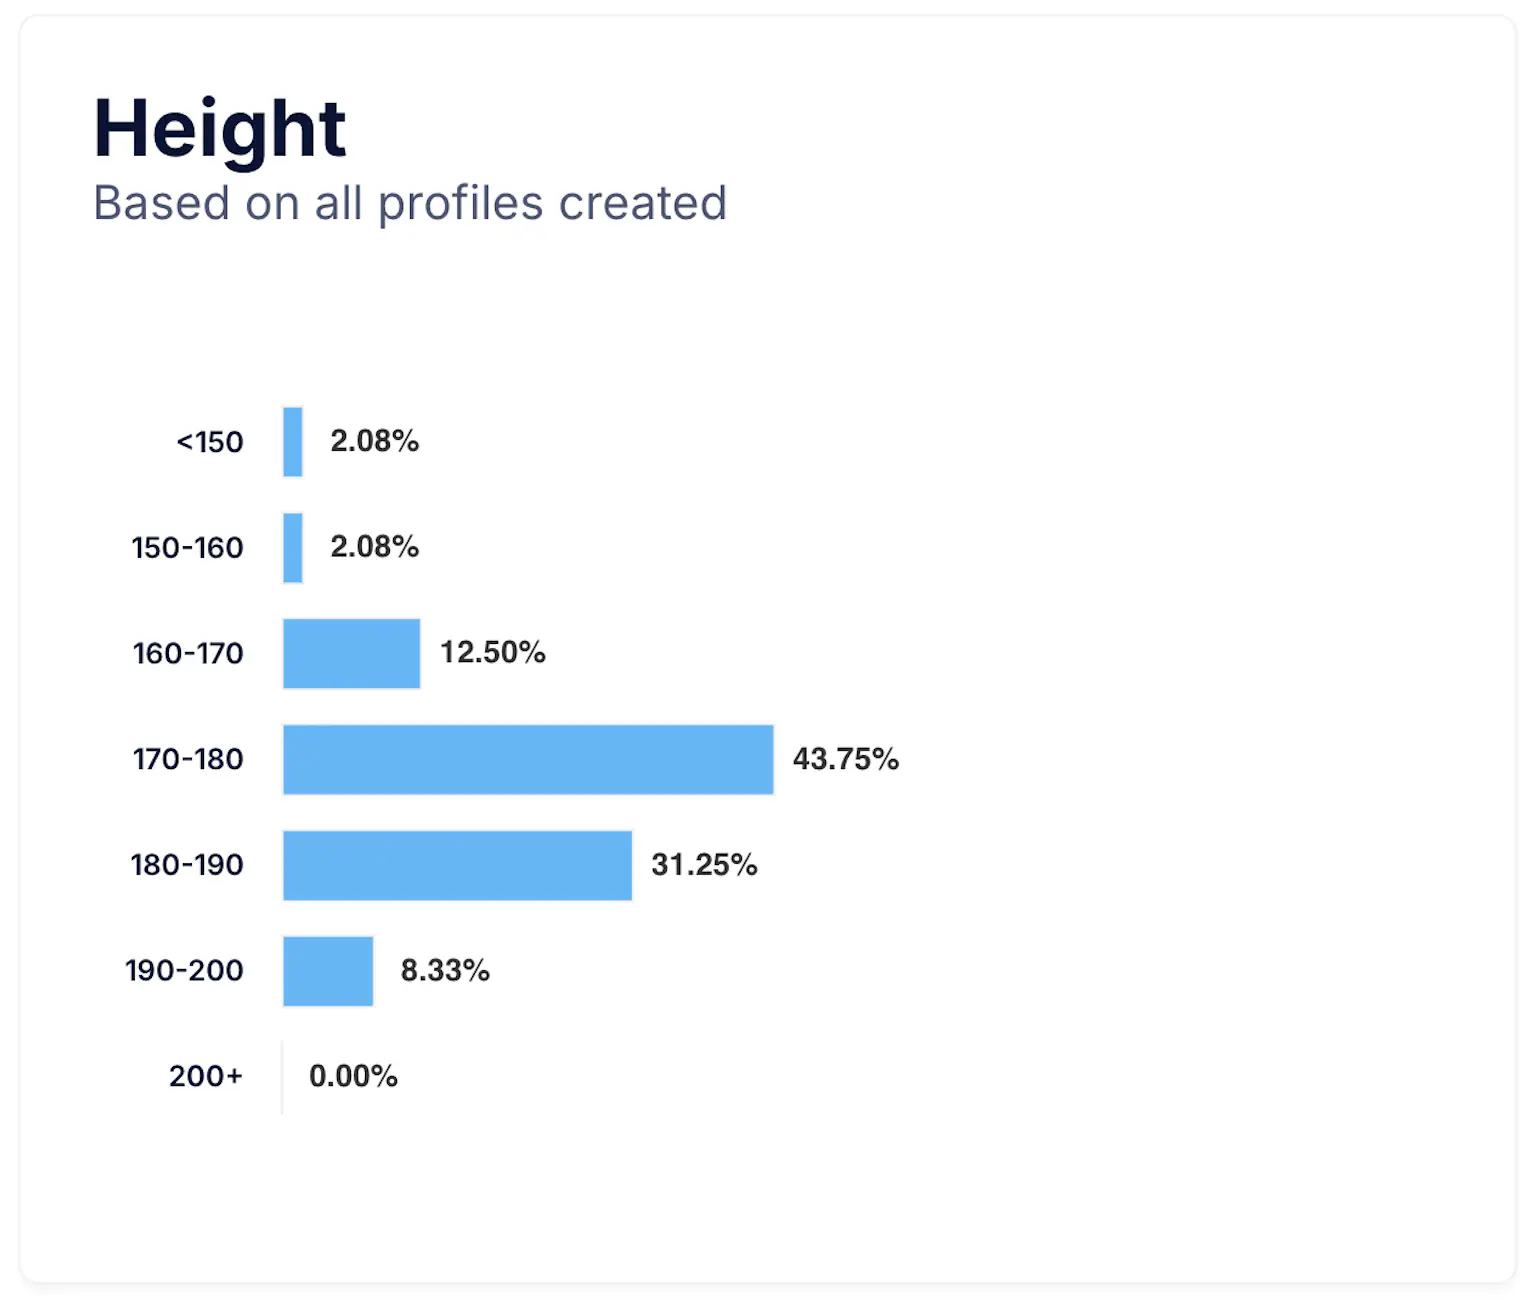
Height bar chart
This chart illustrates the distribution of user Height based on all created profiles. It provides valuable information about the average height range of your audience, which can guide product fitting strategies and improve the accuracy of Smart Assistant recommendations.
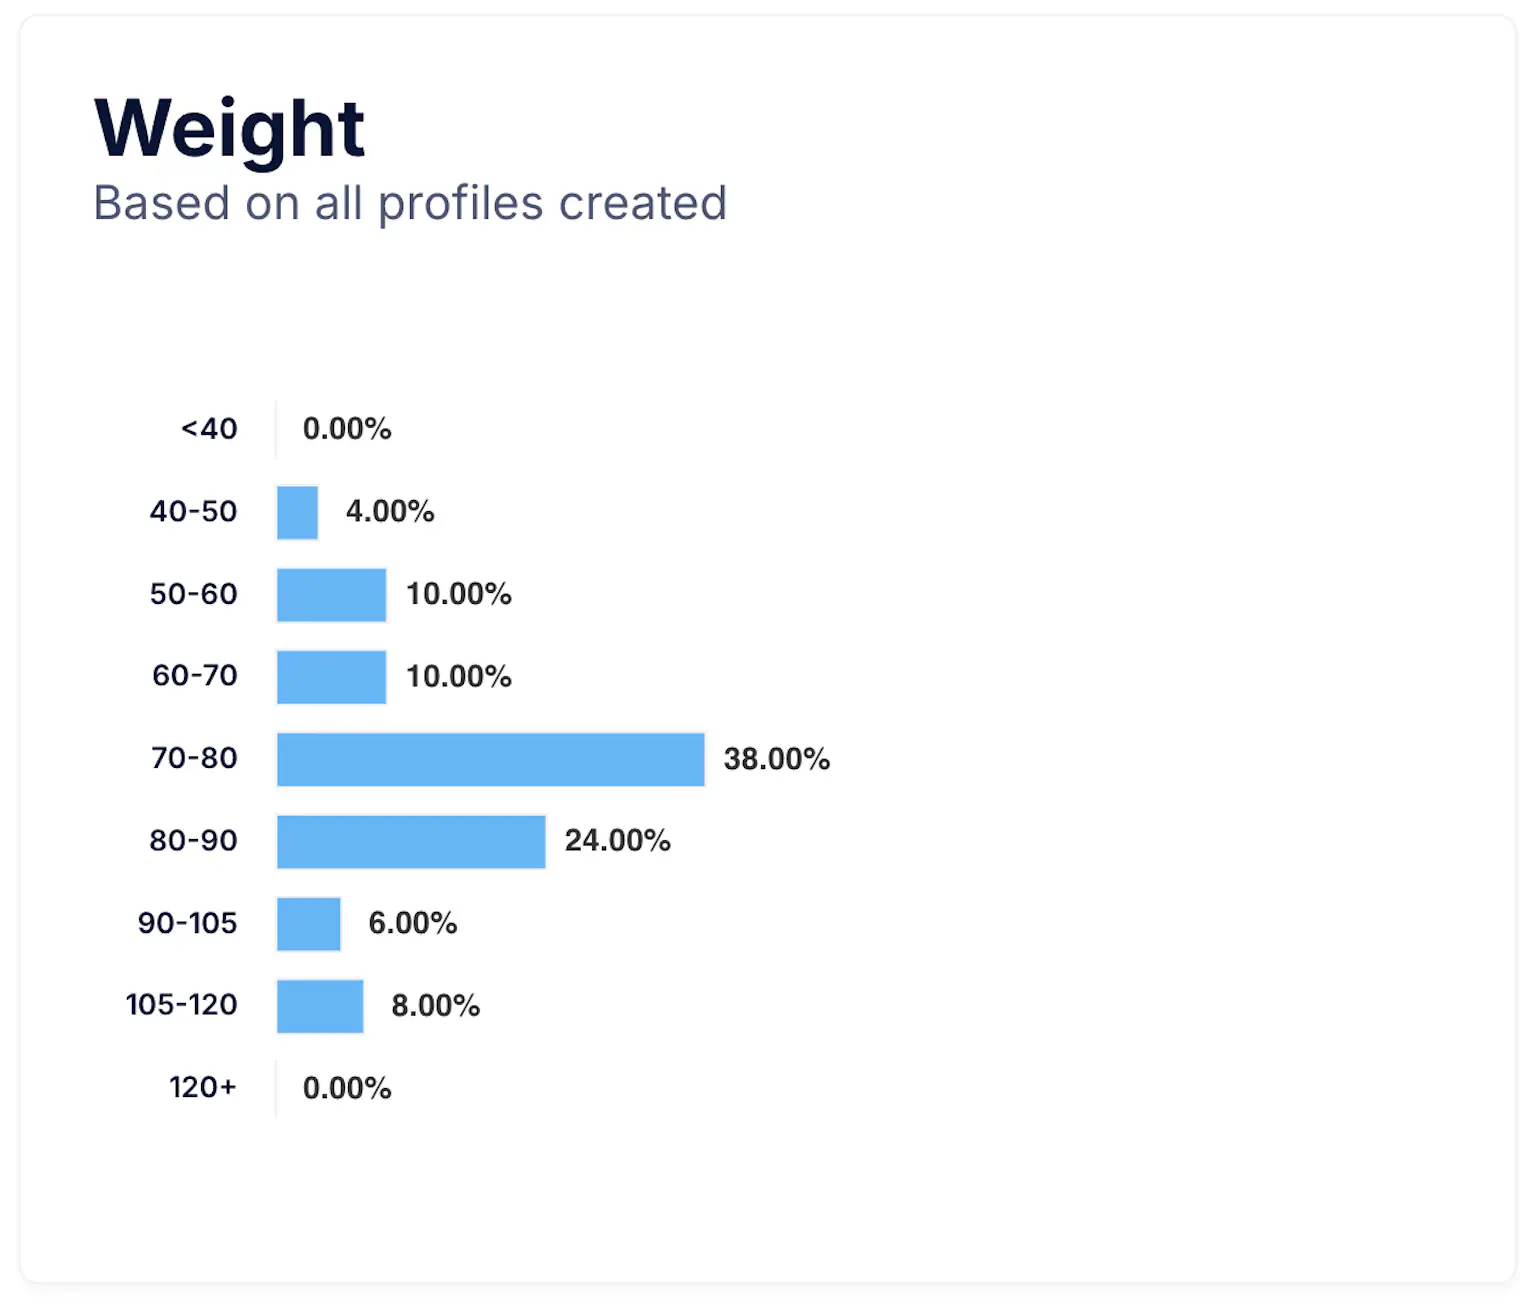
Weight bar chart
Shows how user Weight is distributed across predefined ranges. Together with BMI and height, this information gives a complete physical overview of your user base and helps fine-tune virtual fitting accuracy.
Monitoring these proportions over time can also indicate whether your Smart Assistant is expanding to different demographic or physical profiles.
Notes and Recommendations
- Use demographic filters to identify which audiences interact most with Smart Assistant and how their characteristics evolve over time.
- Compare gender and age data with engagement and conversion metrics to assess whether key audience segments align with your marketing goals.
- Physical indicators such as BMI, height, and weight are anonymized and aggregated to ensure privacy, while still providing valuable insights for fitting and personalization.
- Combine this data with the Active Users and Conversations pages to gain a complete understanding of both user profile and behavior.